
Graphing systems of equalities is a concept that pops up in algebra 1, algebra 2, and in college and university, beginning and intermediate algebra classes. The method most textbooks and instructors use to graph inequalities is so painful because it takes so much time, effort, and sheer arithmetic. Graphing systems of inequalities is like climbing Mount Everest!
What are systems of inequalities?
Systems of inequalities are similar to systems of equations. However, the main difference is that inequalities have an area or range of values as a solution set, while equations either have 1 solution, many solutions, or no solution. A system of inequalities has an intersecting range of values that, when “plugged in,” make both inequality statements true. Neither can be false, or that value is not a solution.
How to graph a system of inequalities
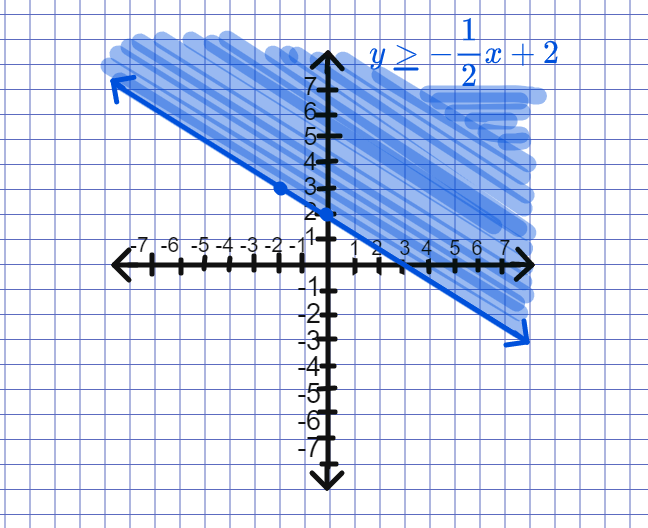
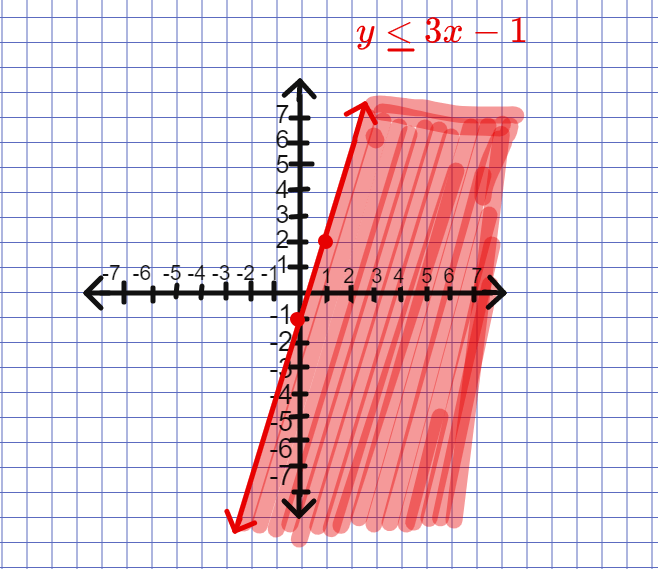
Inequalities are simple to graph. Remember that when you graph a linear equation, you always have a solid line as the solution. However, a shaded area is the solution to an inequality, whether or not the line is included as part of it. The symbols ≥ (greater than or equal to) and ≤ (less than or equal to) signal that the line you graph must be a solid line, while the symbols > (greater than) and < (less than) mean a dotted line. That means that the line itself is either included (solid) or excluded (dotted) as part of the solution, which is the shaded area.

You graphed the line, but what about shading?
In the olden days of algebra, if you graphed an inequality, you just needed to pick two sets of ordered pairs (a.k.a. points) on either side of the line. Then you plugged them in for x and y, respectively, and checked if each pair made the inequality true or false. Finally, you shaded the right area: above or below the line.
However, it was much worse to do the same process for a system of inequalities. You ended up with 4 areas you needed to test, which meant 4 different pairs of points!
Happily, during my years of teaching, I discovered a much shorter way to approach the shading step. I personally didn’t invent the shortcut, but I adopted it into my book of math tricks all the same.
It’s not where you shade but how you shade
First, ask yourself the right question.
Instead of wondering how much time it will take to pick 4 different points, plug them in, simplify all the numbers and mark the answers true or false…
Think outside the box. After all, math is supposed to make sense.
Arrows point up, down, left, or right. Usually, when arrows point to the left, that means that numbers are getting smaller or we’re going in a negative direction. If arrows point to the right, numbers are getting bigger or we’re going in a positive direction. Greater than, >, points to the right. Less than, <, points to the left.
Greater than means shade above. Less than means shade below.
Yes, it is really that simple. And it doesn’t matter if the slope of a line is negative or positive. Above and below still work the same way.
Next, shade for one line at a time.
Don’t worry about the final answer just yet.
Now it’s time to see where the shaded areas meet.
After you’re done shading, you’ll notice that there must be an intersecting area. Where does the shading for each line overlap?

If you use different colors like I did, the answer is obvious. Out of 4 possible areas, only one can work. The overlapping area that follows the greater than/less than rules of both inequalities is the solution area.

In the words of the great Archimedes: Eureka! The intersecting shaded area is your solution set. I hope this easy-as-pie shortcut helps you on your graphing journey, algebra course or whenever math takes you!
“Natalie is patient and understands her students. She is thorough with her explanations and will repeat the problem until you understand. She has great math tricks to simplify difficult concepts.”
— Michelle, 3 lessons with Natalie
